In my Geology class, we are studying hazards. Actually, let me back up. What’s kind of fun is that I have the same teacher for both Geography and Geology, and she gives each student an amount of “money” between 350 k and 2 million, and with that “money” you have to “buy” a house in the Bay Area. Then, you study Geography and Geology by looking at “your” house and its location. Most of the students are around 18 years old, so for them this is a fantasy experience and helps them prepare for the adult world. For me, I’m enjoying taking all of these things we’re learning (i.e. what color should you paint your house based on insolation, albedo, absorption, to keep it cool in summer? what happens if you live west of the freeway on the east side of the bay, pollution-wise with the sea breeze? etc) and applying them not only to my pretend house, but to our real house in Walnut Creek. (Just for the record, my pretend house for Geography is in Richmond, and my pretend house for Geology is in Vallejo, I got $350 k for each of them, so that’s why they are in those locations. For those of you who don’t live in the Bay Area, those are two of the least desirable locations. To live, say, even in Oakland, you need to have a good $750 k, and if you want to live in Berkeley, a cool million or more, depending on views. Yes, this reminds me to say that we are studying the housing crisis here in my Political Science class, and it is enlightening.)
Hence my post a while back about the rocks underneath your property and how to figure out the age and formation of those rocks. But, at the moment, we are looking at hazard zones. The information I’m going to give here is Bay Area specific; if you live elsewhere, I’m sure you can find a local government website that can give you this, but you might need to do some digging. For those who live in the area, hopefully this will help you prepare. The website I’m going to share is new to me, I don’t know if it was around when we bought this house 15 years ago, but if it was, I never heard of it. Of course we had the hazards given to us in our mortgage agreement, and we knew that we were in a flood zone and had to pay for flood insurance as a condition of our mortgage, but that’s about all I remember. It was in the middle of our first leukemia year with Adam, he was 2 and Kate was 1 and there were other things on our mind. Sometimes I wonder how we ever managed a move at all. Anyway….
If you live here, there is a website dedicated to the local governments. It is called, fittingly enough, Bay Area Association of Governments. From here I got to their ‘Resilience’ program, which you can find HERE. My address is what’s inputted for this exercise, but you’ll want to put in your address to find out your hazards. Meanwhile let’s look at my house and the hazards I found here.
Let’s look at Earthquakes first, since that’s the first thing everyone thinks about when they think about California.
So if you go to the left of the picture, and click on ‘Shaking Scenarios,’ you can choose your fault and see what’s up. After the colors come up, go to the left again and click on ‘Legend.’ That will tell you what the colors mean. I’m going to click on ‘Mt. Diablo’ for the fault, since that’s closest to us, and let’s see what the shaking scenario is.
Yikes! All that red can’t be good. And indeed it’s not. This, according to the legend, is a very strong shaking event. Well, what does that mean? Let’s look at this chart from the USGS (United States Geologic Survey):
“Some thrown forcibly to the ground.” “Damage considerable in some buildings designed to be resistant” (!) “Buildings shift off foundations if not bolted to them.” Guess what I’m going to check about our house, ASAP???
However, if I take off Mt Diablo fault and add Hayward Fault (the second closest fault to us), I get this:
Phew. Strong, but better. Damage could be bad in old buildings that aren’t prepared. All of this makes me think we should be buying earthquake insurance, though some folks think it’s not any better than just your homeowner’s. I’ll let you do your own research on that.
Ok, let’s move on to flooding. I said that we have flood insurance already because we were told our home was in a flood zone. It’s hard to see, because we get so very little water here, but in moments like last week when I watched our back yard become a lake, it gets a little easier to imagine. Flood insurance is expensive, and many of our neighbors have had engineers come out and determine that they didn’t need to pay it anymore; they fill out a form and send it in to FEMA and that’s that. We have not done that, and are still paying the insurance, and after seeing this map, I’m glad. One thing that’s not so evident in real life is the system of creeks that carry water from Mt Diablo down to our neighborhood. On this map, that’s what’s happening when there is a big flood. Here’s how I got there - unclick any fault information in shaking, and go to ‘Flooding.’ Then click FEMA map. Here’s what I get:
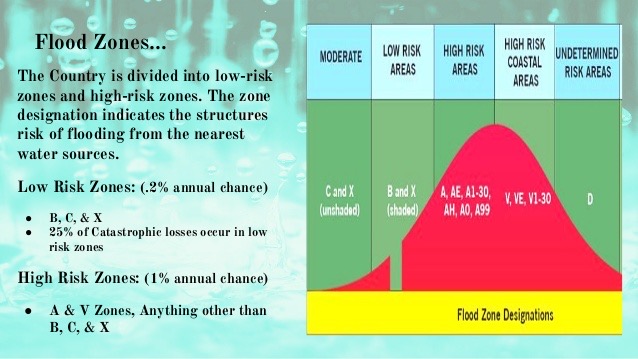
So now I go to the legend, and I see we’re in dark blue which is “AO” or “AH,” I can’t tell, but what do those mean anyway? Let’s take a look:
This is directly from FEMA. Whether it’s AO or AH it doesn’t really matter, it means we have an annual chance, albeit a low one, of flooding. Glad we have that insurance.
This makes me think of liquefaction. Liquefaction is what happens when you live in a watery place and an earthquake causes the ground to become like a big, shaking waterbed. Think landfill, like the edges of San Francisco, a good portion of Alameda, Emeryville, etc. If we have so much water in our area, if the water table is so high, does that mean we’re at risk for that, even though we’re not on landfill? Well, let’s check. Unclick the FEMA thing, and go to ‘Other Earthquake.’ Then click on ‘Liquefaction Susceptibility.’
Oh dear. At this point, I don’t like to see any color at all. Well, what’s the legend say? “Moderate Susceptibility.” Hm. I guess I feel moderately about that. Not exactly reassured.
Ok, let’s look at the thing that scares me the most, Wildfire. Unclick all the Liquefaction stuff and go to “Wildfire.” Then click on “Urban-Wildlife Interface.” (This is the area I think I want to study in grad school or work in eventually.)
Legend: “Wildland Urban Interface Fire Threat.” Well, crap.
Ok ok, let’s just go all in, let’s look at landslides. We’re under Mt. Diablo, and have foothills surrounding us on three sides, so it’s possible I guess. Unclick all the fire stuff and click on “Landslide.” Let’s look at “Rainfall induced landslide” first.
Hooray, we’re in the clear!
Let’s look at “Earthquake induced landslide” next. Will it also be good news???
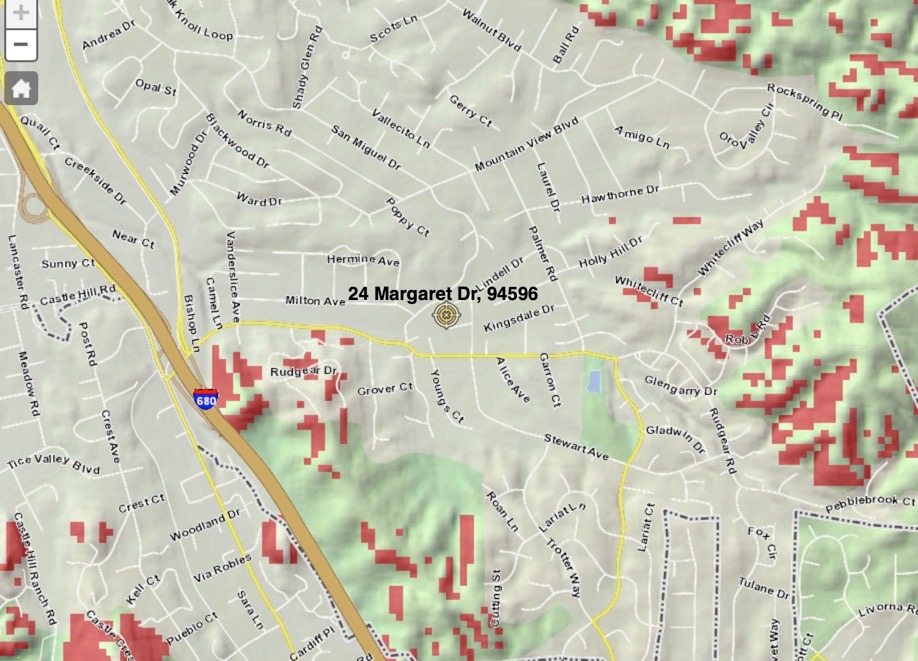
Hm… legend? “Area Not Yet Evaluated.” Well ok, let’s see the existing landslide distribution, then - maybe that will help.
OOOO, close, but it just misses us. Hallelujah. That’s one thing I don’t have to worry about!
So you see how this could be a valuable tool for preparing your home for a local hazard event. There are several things we can do, right away, to make this home more safe.
I hope this helps you plan for hazards in your areas, too. If nothing else, it’s fun to go and click around on the map. Go ahead, take a look at San Francisco, and see what it’ll be like for folks living in the Millennium Tower.


